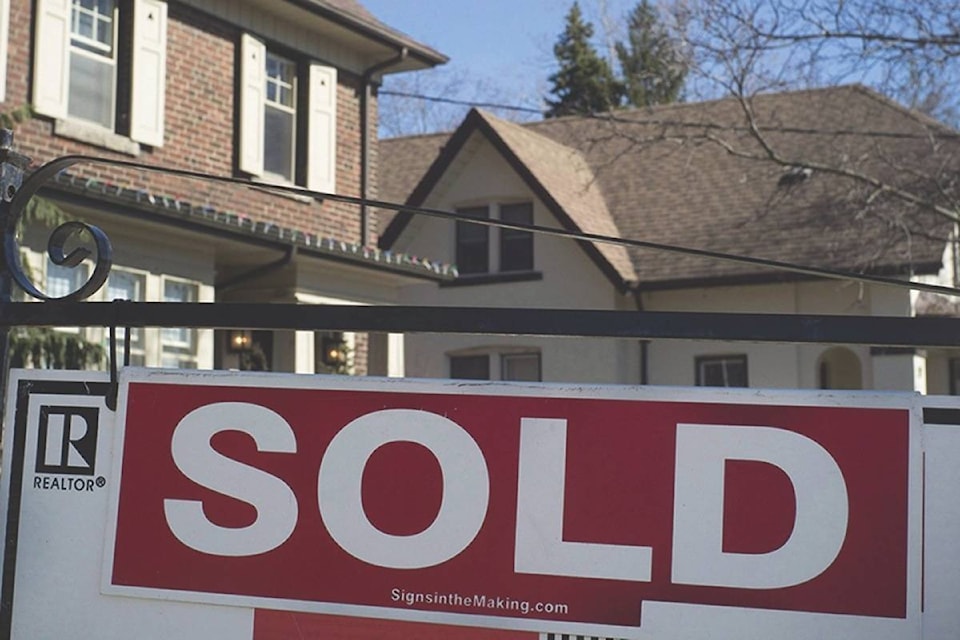
The share of household income Terrace residents put in to home ownership has remained steady over the past four years, despite the upheaval caused by the uncertainty of major projects coming into the area. According to a report on housing affordability indicators released by the BC Northern Real Estate Board March 15, in 2017 Terrace residents spent on average 32.66 per cent of their household median income, before taxes, for the comfort of owning their own home.
That figure places the city third to last in housing affordability in the north: followed by Prince Rupert at 33.05 per cent and 100 Mile House in last place at 36.33 per cent.
The Housing Affordability Indicators report defines the cost of home ownership by including mortgage costs, municipal taxes and fees, and utilities for average single family homes.
READ MORE: Terrace Realtors warn of new real estate rules
The BCNRB is quick to point out that affordability in the north remains “exceptionally affordable” when compared to the south. There, families in 2017 gave up roughly 62 per cent of their income in Victoria, and 116 per cent in Vancouver when mortgaging a home.
READ MORE: Housing prices forecast to stay high despite moderating demand: BCREA
In most cases, worsening affordability is caused by increases to the average house price. In the north, the most affordable place to live and buy a home is Mackenzie at 20.13 per cent and Kitimat at 20.63 per cent.
The average price of a single-family dwelling sold in the north was about $290,000, with an average affordability factor of 28.19 per cent.
READ MORE: Strict mortgage rules slow B.C. home sales
The report bases its figures on the RBC Housing Affordability Measures, and mortgage costs based on the average house price with 25 per cent down and amortization over 25 years at a five-year fixed rate.
The benchmark data for median household incomes is extrapolated from the 2011 National Household Survey, and then adjusted with the growth rate for average weekly earnings reported to Statistics Canada.
The median income total used for comparison is an average of all northern communities.
quinn@terracestandard.com
Like us on Facebook and follow us on Twitter